About
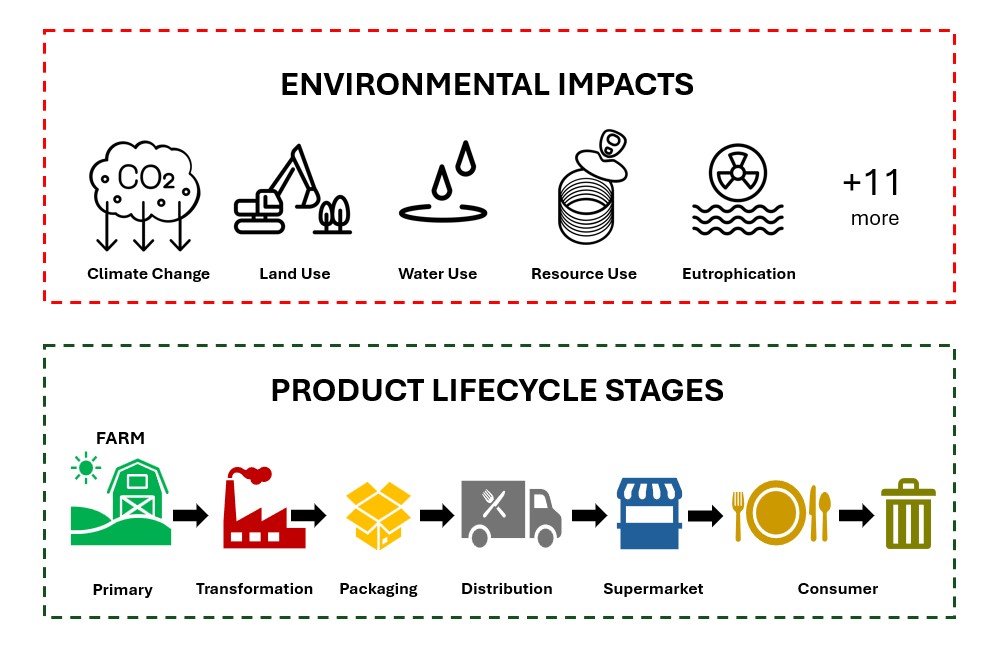
- This app is a data visualisation of environmental IMPACT INDICATORS for packaged foods in Australia across their LIFECYCLE STAGES.
- It combines food composition data with Lifecycle Assessment (LCA) data to estimate the environmental impact (e.g. GHGe for Climate Change) of individual food items for 16 different Impact indicators across the product's Lifecyle.
- The data can be viewed for each of the different environmental Impact Indicators for each Lifecycle Stage - from Primary through to Consumer, or in custom views or aggregations.
- The Planetary Health Score uses the overall Impact (all Indicators) of a product across its entire product Lifecycle. It is scored from zero (worst) to 100 (best).
- The different headers give different views of the data, such as focusing on a single category or comparing several categories in one chart.
- Category data (for example Breakfast Cereals) represent an aggregation of individual item data held in our database not simply a category level assignment.
- This visualisation represents a sample of our data as we work to update and increase the coverage.
- Please refer to the Glossary sheet for background and details.
Filters
Lifecycle Stage - Share of Impact - single category - single Indicator (see notes below)
Lifecycle Stage impact values - single category - single indicator (see notes below)
Explanatory notes
- View a single food category (e.g. Breakfast Cereals) by a single Indicator (e.g. Climate change)
- Pie Chart: See the share of impact for the chosen Indicator for each Lifecyle Stage
- Bar Chart: See the amount of impact for the chosen Indicator for each Lifecycle Stage
- 'n' represents the number of items in the category
- n.b. Some Lifecycle Stage details are included in the preceeding Stage (e.g. 'Transformation' for Cheese)
Filters
Compare categories - by Lifecycle Stage(s) - for single Indicator (see notes below)
Explanatory notes
- View a multiple food categories (e.g. Breakfast Cereals) by a single Indicator (e.g. Climate Change)
- View all Lifecycle Stages combined or select a single or several Lifecycle Stages
- Bar Chart: The black dot is the MEDIAN value of the indicator for that food category
- Bar Chart: The purple bar marks the 25th to 75th percentile of values in that food category
Filters
Compare categories - Lifecycle stage impact for single indicator (see notes below)
Explanatory notes
- View multiple food categories by a single indicator (e.g. Climate change)
- View share of impact due to each Lifecycle Stage
- Chart: Each colour shows % of impact of a lifecycle stage
Filters
Planetary Health Score by category (see notes below)
Explanatory notes
- This chart shows the distribution of Planetary Health Scores for each food category
- A higher Planetary Health Score is better (less harmful) for the environment
- Bar Chart: The black dot is the MEDIAN value for that food category
- Bar Chart: The purple bar marks the 25th-75th percentile of values in that food category
Filters
Climate Impact by Lifecycle Stage (see notes below)
Details of selected stage:
Explanatory notes
- This page shows data for a sample of individual products in our database
- See how Climate Impact varies between pairs of similar items in the same catetegory
- Products are organized in pairs (Brand A vs. Brand B) to allow you to directly compare the environmental impact of similar items
- Interactive Pie Chart: Click and highlight a segment / Lifecylce Stage
- Bar Chart: See the detailed components (e.g. product ingredient for Primary) for Climate Change
- A higher Planetary Health Score rating indicates a more environmentally friendly product, while lower scores reflect greater environmental impact
- Some Lifecycle Stage details (e.g. Tranformation) are included in the preceding Lifecyle Stage
Glossary